Test Online Free Tableau TDA-C01 Exam Questions and Answers
Practice a live sample before buying full access. This page keeps the free TDA-C01 question set organized by page so visitors and search engines can reach the canonical -questions.html URL directly.
You want to connect a Tableau workbook to a dataset in a Microsoft Excel spreadsheet.
What should you do from Tableau Desktop?
Answer: Explanation:
To connect a Tableau workbook to a dataset in a Microsoft Excel spreadsheet, you need to select New Data Source from the Data menu. This will open the Connect pane, where you can choose Microsoft Excel as your data source and browse for your spreadsheet file. You can then drag and drop your sheets or tables to join or union them in the data source page.
Reference:
https://help.tableau.com/current/pro/desktop/en-us/connect_basic.htm
https://help.tableau.com/current/pro/desktop/en-us/connect_excel.htm
Question 17Selectable Answer
You have the following dashboard that contains two visualizations.
You want to show only visualization at time. Users must be able to switch between visualizations.
What should you me?
Answer: Explanation:
Showhide buttons are a feature that allows you to show or hide a layout container on a dashboard. You can use showhide buttons to create a toggle effect that switches between two visualizations. You need to place each visualization in a separate layout container and then add a showhide button for each container. You can customize the appearance and behavior of the buttons to suit your needs.
Reference:
https://help.tableau.com/current/pro/desktop/en-us/dashboards_organize_floating_layoutcontainers.htm
https://help.tableau.com/current/pro/desktop/en-us/dashboards_showhide.htm
Question 18Selectable Answer
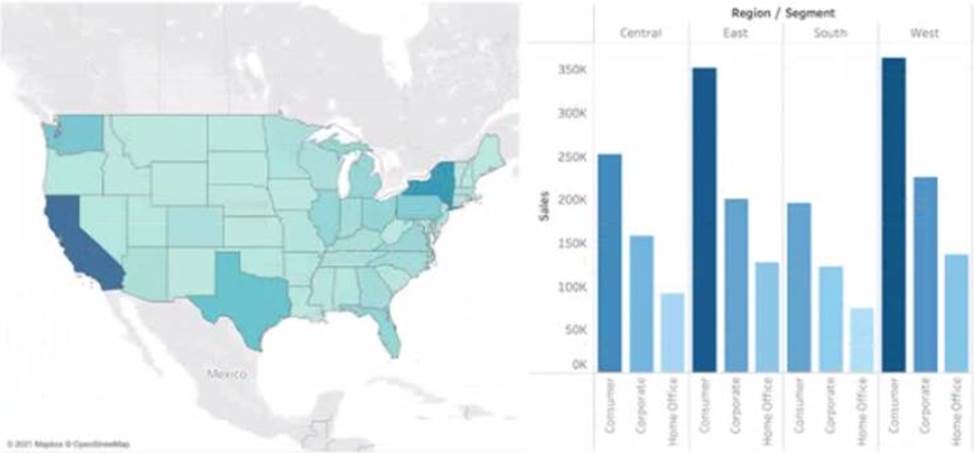
You have the Mowing dashboard.
Which two elements are floating? Choose two.
Answer: Explanation:
To identify which elements are floating on a dashboard, you can look for a gray border around them when you select them. Alternatively, you can open the Layout pane and see which elements have a pin icon next to them. The pin icon indicates that the element is floating and can be moved freely on the dashboard. Based on these criteria, the state filter and the color legend are floating elements on the dashboard.
Reference:
https://help.tableau.com/current/pro/desktop/en-us/dashboards_organize_floating_layoutcontainers.htm
https://help.tableau.com/current/pro/desktop/en-us/dashboards_create_layouts.htm
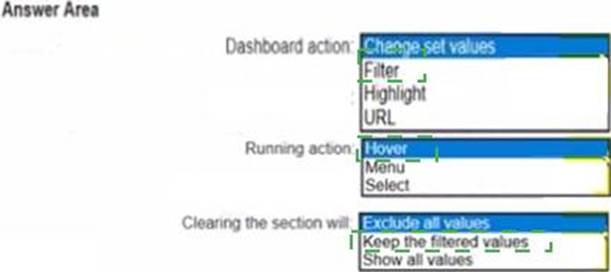
Question 19Written Answer
HOTSPOT
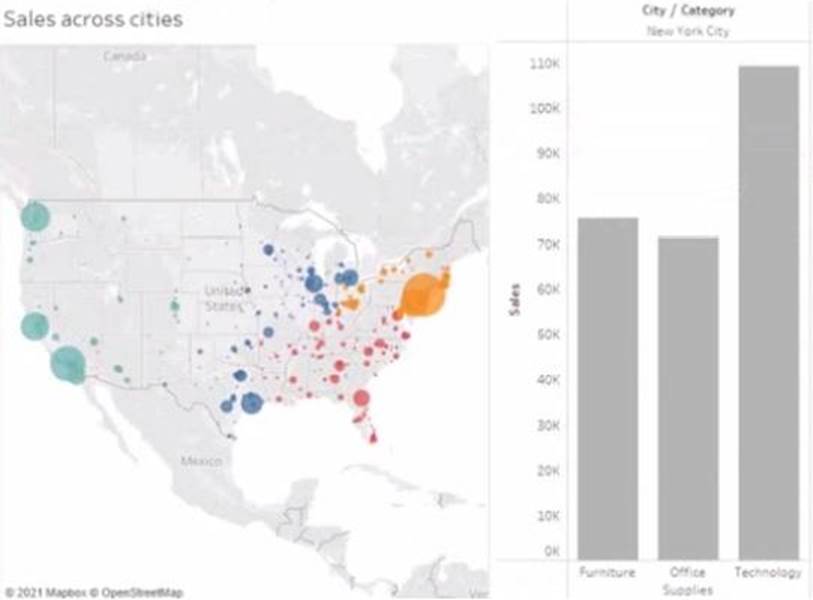
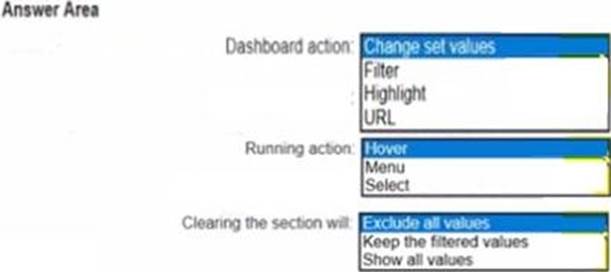
You have the following dashboard.
When a user selects a only on the map the data on the bar chart must show only the data for the selected city. The data in the bar chart must change only when the user selects a different city.
How should you configure the dashboard action? (Use the dropdowns in the Answers Area to select the correct options.)
Answer:
Explanation:
To configure the dashboard action, you should select Filter as the action type, Select as the run action on option, and All Fields as the target filters option. This will ensure that when a user selects a city on the map, the bar chart will show only the data for the selected city based on all fields in common between the two worksheets. The action will run only when the user selects a different city.
Reference:
https://help.tableau.com/current/pro/desktop/en-us/actions.htm
https://help.tableau.com/current/pro/desktop/en-us/actions_filter.htm
Question 20Selectable Answer
You have a line chart on a worksheet.
You want to add a comment to March 2020 as shown in the following visualization.
What should you do?
Answer: Explanation:
To add a comment to March 2020 on a line chart, you need to annotate that mark. You can right-click on the mark and select Annotate > Mark from the menu. This will open a dialog box where you can type your comment and format it as you like. You can also drag and drop the annotation to position it on the worksheet. Dragging the growth rate to Text on the Marks card will add a label to every mark on the line chart, enabling captions will show a description of the worksheet at the bottom, and adding a tooltip will show a text box when users hover over a mark.
Reference:
https://help.tableau.com/current/pro/desktop/en-us/formatting_annotations.htm
https://help.tableau.com/current/pro/desktop/en-us/formatting_annotations_create.htm
Question 21Selectable Answer
You are the owner of an alert.
You receive an email notification that the alert was suspended From where can you resume the suspended alert?
Answer:
Question 22Selectable Answer
You have a data source that contains data tor every city in the Unites States. The following is a sample of the data.
You need to use the City dimension to create a dynamic filter that snows the cities that have a population greater than one million Which type of filter should you use?
Answer:
Question 23Written Answer
CORRECT TEXT
Open the link to Book1 found on the desktop. Open the sales dashboard.
Add the Sales by State sheet in a Show/Hide button to the right side of the dashboard.
Answer: Send us your feedback on it.
Question 24Selectable Answer
You have the following dataset.
When you use the dataset in a worksheet, you want Sales to appear automatically as shown in the following table.
What should you do?
Answer:
Question 25Selectable Answer
You have a dataset that contains people and the awards they have won.
Which formula should you use to get the number of different types of awards that have been won?
Answer:
Question 26Selectable Answer
You have the following box plot that shows the distribution of average profits made in every state by region.
Which region has the smallest distribution of profits?
Answer:
Question 27Written Answer
CORRECT TEXT
Open the link to Book1 found on the desktop. Use the Superstore data source.
Split the Customer Name field into two fields named First Name and Last Name.
Answer: Send us your feedback on it.
Question 28Selectable Answer
You want to add a draft watermark to a dashboard as shown in the following exhibit.
Which type of object should you use?
Answer:
Question 29Selectable Answer
You have the following dataset.
You plan to create a dashboard that will be filtered to show only data that is relevant to a specific Tableau user based on the Tableau_User_Name field You need to create a boolean calculated field to place on the data source finer Which formula should you use for the filter?
Answer:
Question 30Selectable Answer
You have the following dataset.
Which Level of Detail (LOD) expression should you use to calculate tie grand total of all the regions?