Test Online Free Tableau TDA-C01 Exam Questions and Answers
Practice a live sample before buying full access. This page keeps the free TDA-C01 question set organized by page so visitors and search engines can reach the canonical -questions.html URL directly.
You plan to create a visualization that has a dual axis chart. The dual axis chart will contain a shape chart and a line chart will use the same measure named Population on the axis. You need to configure be shapes to be much larger than the line.
What should you do?
Answer: Explanation:
To configure the shapes to be much larger than the line, you need to duplicate Population and drag it to the second Marks card. This will create a dual axis chart with two measures on one axis. You can then select Shape on one Marks card and Line on another Marks card, and adjust the size of each mark independently using the Size slider or menu.
Reference:
https://help.tableau.com/current/pro/desktop/en-us/multiplemeasures_dualaxes.htm
https://help.tableau.com/current/pro/desktop/en-us/marks_markproperties_size.htm
Question 2Selectable Answer
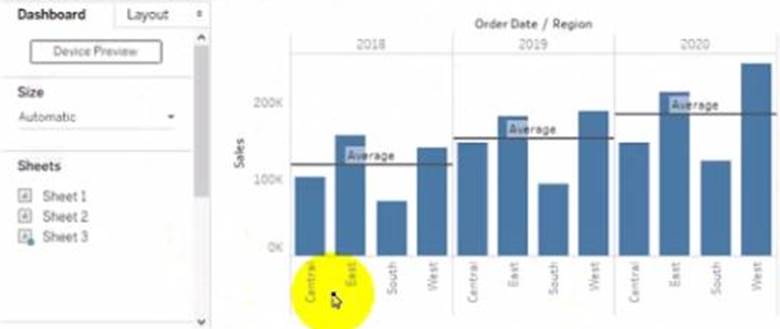
You have the following tiled dashboard that has one sheet.
You want to replace fit sheet with Sheet2.
What should you do?
Answer: Explanation:
To replace a sheet on a tiled dashboard, you can simply drag the new sheet from the Sheets pane to the dashboard and drop it over the existing sheet. This will replace the old sheet with the new one and keep the same size and position. Alternatively, you can right-click on the old sheet and select Replace Data Source, then choose the new sheet from the list.
Reference:
https://help.tableau.com/current/pro/desktop/en-us/dashboards_organize_floating_layoutcontainers.htm
https://help.tableau.com/current/pro/desktop/en-us/dashboards_replace_datasource.htm
Question 3Selectable Answer
You want to add a comment to March 2020 as shown in the following visualization.
You have the following sets in a Tableau workbook
• Top N Customers
• Customers of 2020
• Top N Products
• Sellers of 2020
Which two sets can you combine? Choose two
Answer: Explanation:
To combine two sets, they must have at least one dimension in common. In this case, Customers of 2020 and Top N Customers both have Customer Name as a dimension, so they can be combined using set operations such as union, intersection, or difference. Sellers of 2020 and Top N Products have different dimensions (Seller Name and Product Name), so they cannot be combined.
Reference:
https://help.tableau.com/current/pro/desktop/en-us/sets.htm
https://help.tableau.com/current/pro/desktop/en-us/sets_create.htm#combine-sets
Question 4Selectable Answer
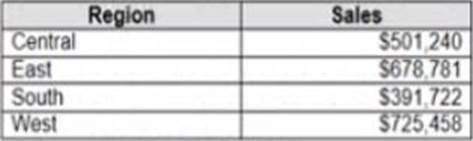
You have the following dataset.
Which Level of Detail (LOD) expression should you use to calculate tie grand total of all the regions?
Answer: Explanation:
To calculate the grand total of all the regions, you need to use a Level of Detail (LOD) expression that ignores any dimensions in the view and returns the total sum of sales. The FIXED keyword allows you to specify the level of detail for the calculation, and the TOTAL function returns the sum of all values in the expression. Therefore, the correct LOD expression is {FIXED: TOTAL (Sales)}.
Reference:
https://help.tableau.com/current/pro/desktop/en-us/calculations_calculatedfields_lod.htm
https://help.tableau.com/current/pro/desktop/en-us/functions_functions_tablecalculation.htm#TOTAL
Question 5Selectable Answer
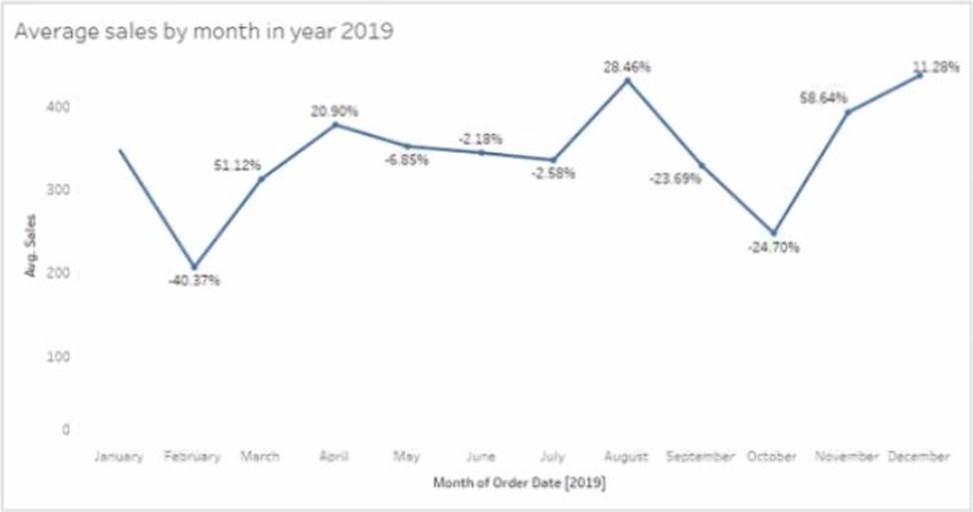
You have the following line chart that shows the average sales by month.
Which month had the biggest increase in swage sales compared to me previous month in 2019?
Answer: Explanation:
To find the month that had the biggest increase in average sales compared to the previous month in 2019, you need to compare the slopes of the line segments between each pair of months. The steeper the slope, the greater the increase. Based on the line chart, October had the steepest slope, meaning it had the biggest increase in average sales compared to September in 2019.
Reference:
https://help.tableau.com/current/pro/desktop/en-us/buildexamples_line.htm
https://www.mathsisfun.com/algebra/line-equation-slope.html
Question 6Written Answer
DRAG DROP
You have the following dataset.
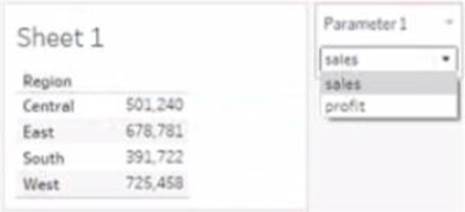
You need to create the following worksheet.
The table must show either profit or sales based on the selection from the Parameter 1 menu.
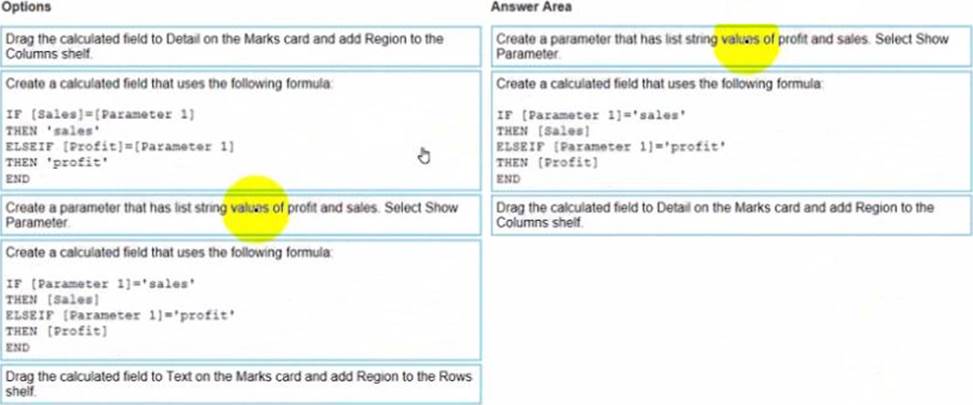
Which three actions should you perform in orders (Place the three correct options in order Use the arrows to move Options lo Answer Area Use Answer Area arrows to reorder the options)
Answer:
Question 7Selectable Answer
You have a dashboard that contains confidential information about patients health. The data needs to always be up to date tor a team of healthcare workers.
How should you share me dashboard with the healthcare workers?
Answer: Explanation:
To share a dashboard that contains confidential information about patients health and needs to always be up to date for a team of healthcare workers, you should publish it to Tableau Server. This will allow you to control who can access and interact with your dashboard, as well as schedule automatic refreshes of your data source or extract. Publishing to Tableau Public would expose your data to anyone on the internet, printing to PDF would not update your data, and exporting as a .twbx would require sending a large file that might not be compatible with other versions of Tableau.
Reference:
https://help.tableau.com/current/pro/desktop/en-us/publish_workbooks_share.htm
https://help.tableau.com/current/pro/desktop/en-us/publish_workbooks_tableauserver.htm
Question 8Written Answer
HOTSPOT
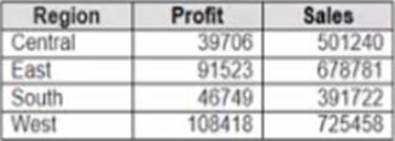
You have the following dataset.
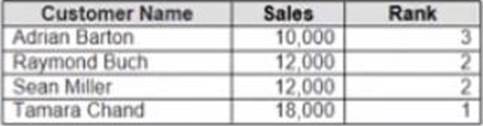
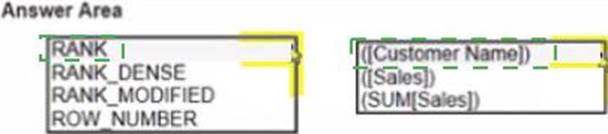
Yon need to calculate the ranking shown in the Rank field.
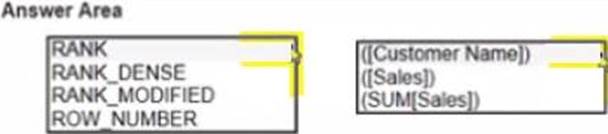
How should you complete the formula? (Use the dropdowns in the Answer Area to select the correct options to complete the formula?
Answer:
Explanation:
To calculate the ranking shown in the Rank field, you need to use the RANK_UNIQUE function, which returns the unique rank of each value in a partition. You need to specify the expression as SUM([Sales]), which calculates the total sales for each product. You also need to specify the order as descending, which means that the highest sales will have the lowest rank. Finally, you need to specify the restart as every [Category], which means that the ranking will reset for each category.
Reference:
https://help.tableau.com/current/pro/desktop/en-us/functions_functions_tablecalculation.htm
https://help.tableau.com/current/pro/desktop/en-us/calculations_calculatedfields_lod_rank.htm
Question 9Selectable Answer
You have a database that includes field named sales, City and Region.
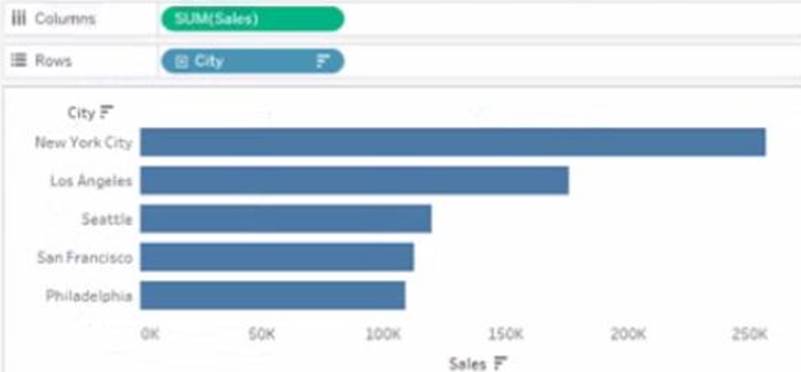
You have the following chart that shows the number of sales made in different cities.
You want to dynamically show the corresponding region when users hover their mouse over any of the bars.
What should you do?
Answer: Explanation:
To show the corresponding region when users hover their mouse over any of the bars, you need to drag Region to Tooltip on the Marks card. This will add Region as a field in the tooltip text that appears when users hover over a mark. You can also customize the tooltip text by editing it in the Tooltip dialog box.
Reference:
https://help.tableau.com/current/pro/desktop/en-us/buildmanual_shelves.htm
https://help.tableau.com/current/pro/desktop/en-us/formatting_tooltips.htm
Question 10Selectable Answer
You publish a dashboard tut uses an attract. The extract refreshes every Monday at 10:00.
You need to ensure that the extract also refreshes on the last day of the month at 18:00.
What should you do?
Answer: Explanation:
To refresh an extract on Tableau Server, you need to select the workbook, select Refresh Extracts, and then add a new extract refresh. You can specify the frequency and time of the refresh, as well as any custom options. You can have multiple extract refreshes for the same workbook with different schedules.
Reference:
https://help.tableau.com/current/server/en-us/refresh_extracts.htm
https://help.tableau.com/current/server/en-us/refresh_extracts_add.htm
Question 11Selectable Answer
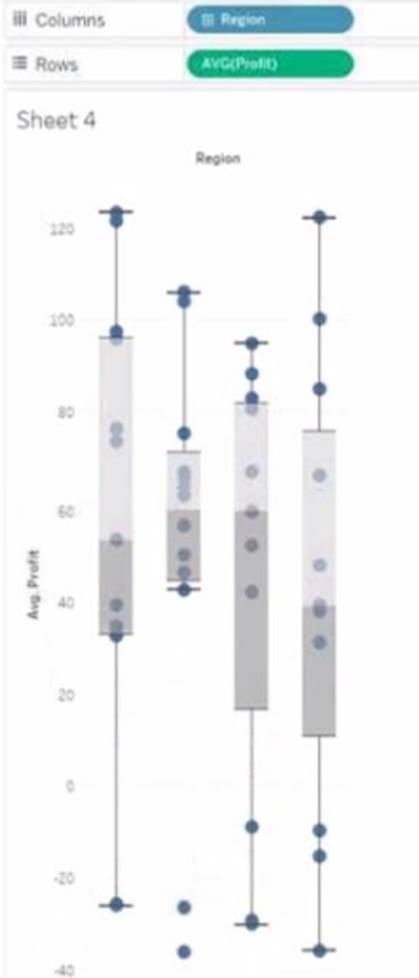
1.You have the following box plot that shows the distribution of average profits made in every state by region.
Which region has the smallest distribution of profits?
Answer: Explanation:
The central region has the smallest distribution of profits because it has the smallest interquartile range (IQR), which is the distance between the first and third quartiles of the box plot. The IQR measures the spread of the middle 50% of the data. The smaller the IQR, the less variation in the data.
Reference:
https://help.tableau.com/current/pro/desktop/en-us/buildexamples_boxplot.htm
https://www.statisticshowto.com/probability-and-statistics/interquartile-range/
Question 12Selectable Answer
A colleague provides you with access to a folder that contains the following files:
• Sates.csv
• Bookl.twb
• Sates.hyper
• Export.mdb
Which He contains an extract?
Answer: Explanation:
A. hyper file is an extract file that contains a snapshot of data from a data source. It is a compressed and optimized file format that can be used to improve the performance and portability of dashboards and workbooks. A .twb file is a workbook file that contains the visualization and connection information, but not the data itself. A .csv file is a comma-separated values file that contains plain text data. A .mdb file is a Microsoft Access database file that contains tables, queries, forms, and other objects.
Reference:
https://help.tableau.com/current/pro/desktop/en-us/save_savework_packagedworkbooks.htm
https://help.tableau.com/current/pro/desktop/en-us/extracting_data.htm
https://help.tableau.com/current/pro/desktop/en-us/examples_csv.htm
https://support.microsoft.com/en-us/office/introduction-to-access-database-files-9f9a0f8c-9a3c-4a0b-8e6c-6d1f1f7c2b7e
Question 13Written Answer
DRAG DROP
You company has two divisions located in the United States and Germany Bach division has a separate database.
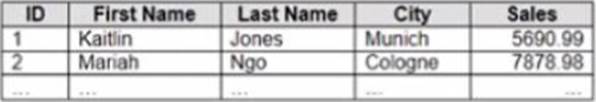
The following is a sample of the sales data for the division in the United States.
The following is a sample of the sales data for me division in Germany.
You have population data in a file named Populatio.csv. the following is a sample of the data.
You plan to create a visualization that ml show tie sales per capita for each salesperson Each salesperson must be identified by identified by their full name.
You need to prepare the data to support the planned visualization. The data source must support being published.
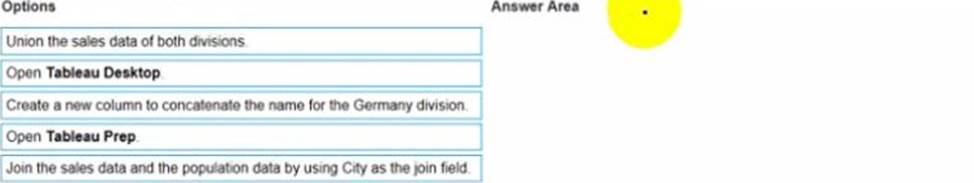
Which four actions should you perform in order? (Place the four correct options n order Use the arrows to move Options to Answer Area arrows to re-order the options. Use Answer Area arrows to re-order the options)
Answer:
Explanation:
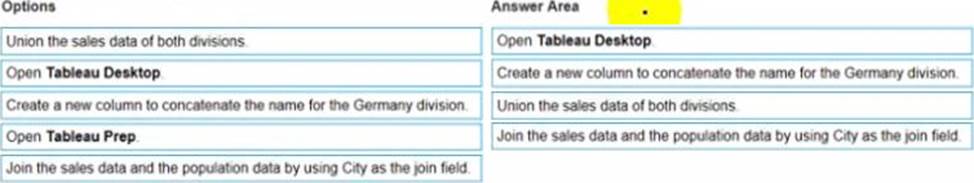
The correct order of the four actions is:
Open Tableau Prep
Union the sales data of both divisions
Create a new column to concatenate the name for the Germany division Join the sales data and the population data by using Country as the join field
The first action is to open Tableau Prep, which is a tool that allows you to prepare and shape your data for analysis. You can connect to various data sources, clean and transform your data, and output it to Tableau Desktop or Tableau Server.
The second action is to union the sales data of both divisions, which means appending them together. This will create a single table that contains all the rows from both tables, with null values for any missing fields. You can use the Union step in Tableau Prep to drag and drop your tables and create a union.
The third action is to create a new column to concatenate the name for the Germany division, which means combining the first name and last name into one field. This will make it consistent with the name field in the United States division, and allow you to identify each salesperson by their full name. You can use the Clean step in Tableau Prep to create a calculated field that uses the CONCAT function to join the two fields.
The fourth action is to join the sales data and the population data by using Country as the join field, which is a common field between them. This will add the population data for each country to the sales data, which is needed to calculate the sales per capita. You can use the Join step in Tableau Prep to drag and drop your tables and choose the join type and fields.
Reference:
https://help.tableau.com/current/prep/en-us/prep_get_started.htm
https://help.tableau.com/current/prep/en-us/prep_union.htm
https://help.tableau.com/current/prep/en-us/prep_clean.htm
https://help.tableau.com/current/prep/en-us/prep_join.htm
Question 14Selectable Answer
You have the following data source in tableau Server.
You need to ensure that the data is updated every hour.
What should you select?
Answer: Explanation:
To ensure that the data is updated every hour, you need to select Extract Refreshes from the data source menu on Tableau Server. This will allow you to add a new extract refresh schedule or edit an existing one. You can specify the frequency and time of the refresh, as well as any custom options or credentials. New will create a new data source, Connected Workbooks will show you which workbooks use this data source, and Connections will show you which tables or files are connected to this data source.
Reference:
https://help.tableau.com/current/server/en-us/refresh_extracts.htm
https://help.tableau.com/current/server/en-us/refresh_extracts_add.htm
Question 15Selectable Answer
You are the owner of an alert.
You receive an email notification that the alert was suspended
From where can you resume the suspended alert?
Answer: Explanation:
To resume a suspended alert, you need to go to the My Content area of Tableau web pages, where you can see all the alerts that you own or subscribe to. You can click on the alert name and then select Resume from the menu. You can also edit or delete the alert from there.
Reference:
https://help.tableau.com/current/pro/desktop/en-us/alerts.htm
https://help.tableau.com/current/pro/desktop/en-us/alerts_manage.htm